Calculadora de Gui de Percentil Baseado em Classificação usando Tkinter
Pré-requisitos:
Python oferece várias opções para desenvolver uma GUI (Graphical User Interface). De todos os métodos de GUI, o Tkinter é o método mais comumente usado. Neste artigo, aprenderemos como criar um aplicativo Rank Based - Percentile Gui Calculator usando o Tkinter, com um guia passo a passo.
Para criar um Tkinter:
- Importando o módulo - Tkinter
- Crie a janela principal (container)
- Adicione qualquer número de widgets à janela principal.
- Aplique o evento Trigger nos widgets.
A GUI ficaria assim abaixo:
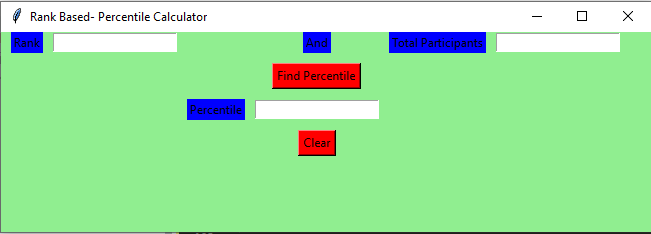
Vamos criar um aplicativo baseado em classificação simples baseado em GUI - Calculadora de percentil Gui:
Abaixo está a implementação:
fromtkinterimport*defgetPercentile() :students=int(total_participantField.get())rank=int(rankField.get())result=round((students-rank)/students*100,3);percentileField.insert(10,str(result))defClear():rankField.delete(0, END)total_participantField.delete(0, END)percentileField.delete(0, END)if__name__=="__main__":gui=Tk()gui.configure(background="light green")gui.title("Rank Based- Percentile Calculator")gui.geometry("650x200")rank=Label(gui, text="Rank", bg="blue")andl=Label(gui, text="And", bg="blue")total_participant=Label(gui,text="Total Participants",bg="blue")find=Button(gui, text="Find Percentile",fg="Black", bg="Red",command=getPercentile)percentile=Label(gui, text="Percentile", bg="blue")clear=Button(gui, text="Clear",fg="Black", bg="Red",command=Clear)rank.grid(row=1, column=1,padx=10)andl.grid(row=1, column=4)total_participant.grid(row=1, column=6, padx=10)find.grid(row=3, column=4,pady=10)percentile.grid(row=4, column=3,padx=10)clear.grid(row=5, column=4,pady=10)rankField=Entry(gui)total_participantField=Entry(gui)percentileField=Entry(gui)rankField.grid(row=1, column=2)total_participantField.grid(row=1, column=7)percentileField.grid(row=4, column=4)gui.mainloop()
Resultado :
As postagens do blog Acervo Lima te ajudaram? Nos ajude a manter o blog no ar!
Faça uma doação para manter o blog funcionando.
70% das doações são no valor de R$ 5,00...

Diógenes Lima da Silva