Como criar uma tabela dinâmica em Python usando Pandas?
A tabela dinâmica é uma tabela estatística que resume uma tabela substancial como grandes conjuntos de dados. Faz parte do processamento de dados. Este resumo em tabelas dinâmicas pode incluir média, mediana, soma ou outros termos estatísticos. As tabelas dinâmicas são originalmente associadas ao MS Excel, mas podemos criar uma tabela dinâmica em Python usando Pandas usando o método dataframe.pivot() .
Sintaxe: dataframe.pivot (self, index = None, colunas = None, values = None, aggfunc)
Parâmetros -
índice: Coluna para fazer o índice do novo quadro.
colunas: coluna para as colunas do novo quadro.
valores: coluna (s) para preencher os valores do novo quadro.
aggfunc: função, lista de funções, dict, numpy.mean padrão
Exemplo 1:
vamos primeiro criar um dataframe que inclui Vendas de frutas.
# importing pandas
import pandas as pd

# creating dataframe
df = pd.DataFrame({'Product' : ['Carrots', 'Broccoli', 'Banana', 'Banana',
                                'Beans', 'Orange', 'Broccoli', 'Banana'],
                   'Category' : ['Vegetable', 'Vegetable', 'Fruit', 'Fruit',
                                 'Vegetable', 'Fruit', 'Vegetable', 'Fruit'],
                   'Quantity' : [8, 5, 3, 4, 5, 9, 11, 8],
                   'Amount' : [270, 239, 617, 384, 626, 610, 62, 90]})
df
# creating pivot table of total sales
# product-wise aggfunc = 'sum' will
# allow you to obtain the sum of sales
# each product
pivot = df.pivot_table(index =['Product'],
values =['Amount'],
aggfunc ='sum')
print(pivot)# creating pivot table of total
# sales category-wise aggfunc = 'sum'
# will allow you to obtain the sum of
# sales each product
pivot = df.pivot_table(index =['Category'],
values =['Amount'],
aggfunc ='sum')
print(pivot)# creating pivot table of sales
# by product and category both
# aggfunc = 'sum' will allow you
# to obtain the sum of sales each
# product
pivot = df.pivot_table(index =['Product', 'Category'],
values =['Amount'], aggfunc ='sum')
print (pivot)# creating pivot table of Mean, Median,
# Minimum sale by category aggfunc = {'median',
# 'mean', 'min'} will get median, mean and
# minimum of sales respectively
pivot = df.pivot_table(index =['Category'], values =['Amount'],
aggfunc ={'median', 'mean', 'min'})
print (pivot)# creating pivot table of Mean, Median,
# Minimum sale by product aggfunc = {'median',
# 'mean', 'min'} will get median, mean and
# minimum of sales respectively
pivot = df.pivot_table(index =['Product'], values =['Amount'],
aggfunc ={'median', 'mean', 'min'})
print (pivot)Saída: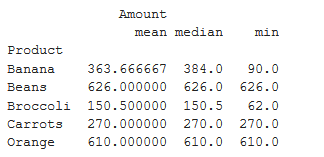
As postagens do blog Acervo Lima te ajudaram? Nos ajude a manter o blog no ar!
Faça uma doação para manter o blog funcionando.
70% das doações são no valor de R$ 5,00...

Diógenes Lima da Silva